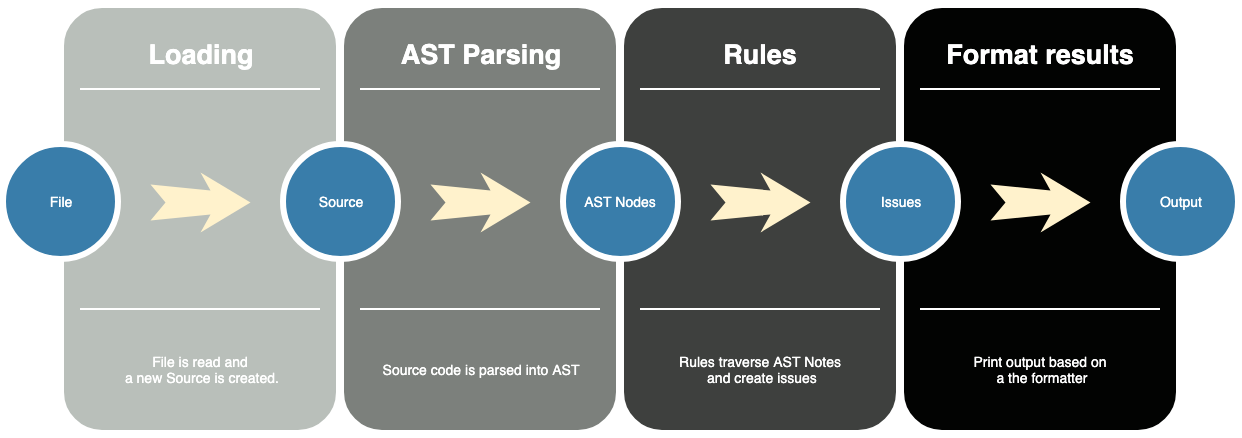
In this article you will find a high level overview of the Ameba’s modules, which will help to understand how it works internally. We will cover everything needed starting from source code loading and finishing by showing results of static analysis.

Ameba and similar command-line applications for static analysis are required to be highly configurable. The end-user, usually, is able to change the configuration, disable or enable that or another checker/rule. Also, he is capable to change the format of the output results. Most of the static analysis tools allow inline disabling and much more…
As you can see, there are a lot of different requirements for such kind of tools and the appropriate design is a key for a good tool architecture and convenient usage.
Let’s take a look at the high-level picture of Ameba’s module architecture.
Source Loading
Of course, the first step of static code analysis is a loading of that source code. It does not matter whether it is a file, a steam or just a regular string, Ameba is capable to read that and create a new Source abstraction. Such internal representation of source code is very convenient to operate on it. For example, it is possible to attach an Issue to this source.
Source also can be created programatically:
1 | require "ameba" |
AST Parsing
Unprocessed source code is a very difficult format for static analysis. Fortunately, Crystal language can do a lot of different ways of source code pre-processing, including AST parsing.
List of AST nodes is a quite convenient representation of a source code to decompose. It is widely used by Ameba internally to do a static analysis.
As you might have noticed, a Source responds to #ast method, which returns a list of AST nodes for that source:
1 | source.ast # => |
In this example, ast method returns an instance of Crystal::ClassDef because the top level node in the source code is a class, which is parsed by Crystal’s AST parser as ClassDef.
Next, nodes are iterated by rules.
Rules
Rule is a basic abstraction that iterates over that or other representation of source code and report issues if such are detected. All rules inherit from Rule::Base.
Most rules visit AST nodes. There is a couple of different visitors which pass needed nodes to the handler. Let’s say there is a rule that disallows calling puts in a code. A simple version of it could look like this:
1 | module Ameba::Rule |
There are two different test method. The first one, which accepts a source is a main entry point to the rule. It returns the AST::NodeVisitor which will visit AST nodes and pass only needed ones to the second test method (handler).
In a handler we just explore the node properties and add issues to the source code if the node matches the expectations.
So, in such a way a Source is passed to all the rules and can hold some issues on it:
1 | rule = Ameba::Rule::NoPuts.new |
Now the source holds an issue. It’s a time to report it.
Format results
Formatters are used to format the output reported by Ameba.
For example, ExplainFormatter is designed to show the detailed explanation of the issue in the source at a specific location. Another one is JSONFormatter which formats to JSON. Let’s give it a try:
1 | formatter = Ameba::Formatter::JSONFormatter.new(STDOUT) |
Formatters are designed to update its states using hooks, like
started- a hook to be called when inspection is startedsource_finished- inspection of a single source is finishedfinished- inspection is finished
If we compile the source code above and run it, we will see:
1 | |
Congratulations, we successfully analyzed our source code and reported an issue.
Wrap-up
In this tutorial we went through the steps to programatically load source code, parse it into AST nodes, create a custom rule, create an issue and show results. It covers the full loop, which Ameba does while doing static analysis. So it can help to understand how it works internally.
The code used above is available as a gist.
Hope you find it useful. Cheers!
Comments